IELTS Writing Task 1: Tables
Tables hand you more data than any other Task 1 question and no visual shape to guide you. The entire skill is selection: an answer that tries to cover every cell runs long, loses coherence and still misses the main features.
What the question looks like
Rows and columns of raw figures, sometimes with a totals row. There may or may not be a time dimension — check, because it decides whether you are describing change or difference.
The instruction line is the same on every Academic Task 1 question: Summarise the information by selecting and reporting the main features, and make comparisons where relevant. You have about 20 minutes and need at least 150 words.
The overview sentence
Find the extremes: the highest and lowest figure anywhere in the table, and the clearest pattern running along a row or down a column. That is your overview.
Overall, housing took the largest share of household income in every country listed and entertainment the smallest, with the widest variation between countries occurring in food and drink.
How to structure the answer
- 1
Introduction
Paraphrase the prompt, naming what the rows and the columns each represent.
- 2
Overview
The highest and lowest figures overall, plus the clearest pattern.
- 3
Body 1
The row or column containing the extremes, with figures.
- 4
Body 2
The next most notable pattern, and any clear exception to it.
Language for tables
Lexical Resource is a quarter of your Task 1 mark. These are the phrases this question type actually calls for.
- Signalling selection
- the most striking figurenotablyby far thethe clear exception
- Ranking
- ranked highestcame secondwas the lowest of the fivetopped the table
- Range and spread
- ranged from X to Yvaried betweenthe spread was widest for
- Contrast across rows
- in contrastwhereascompared withwhile
Mistakes that cost marks
- Trying to describe every cell.
- Pick the extremes and one or two patterns. Deliberately ignore the rest.
- Reading down the table when the pattern runs across it.
- Check both directions before choosing how to group your body paragraphs.
- Ignoring a totals row.
- Totals often hold the clearest overview point in the whole table.
- Producing a list of numbers with no comparison.
- Figures should support a comparison, never stand alone as the sentence.
- Losing the units.
- '5' and '5%' are different claims. Carry the unit through every figure.
Tables: sample questions
Real table questions in the exam format. Give yourself 20 minutes and 150 words for each.
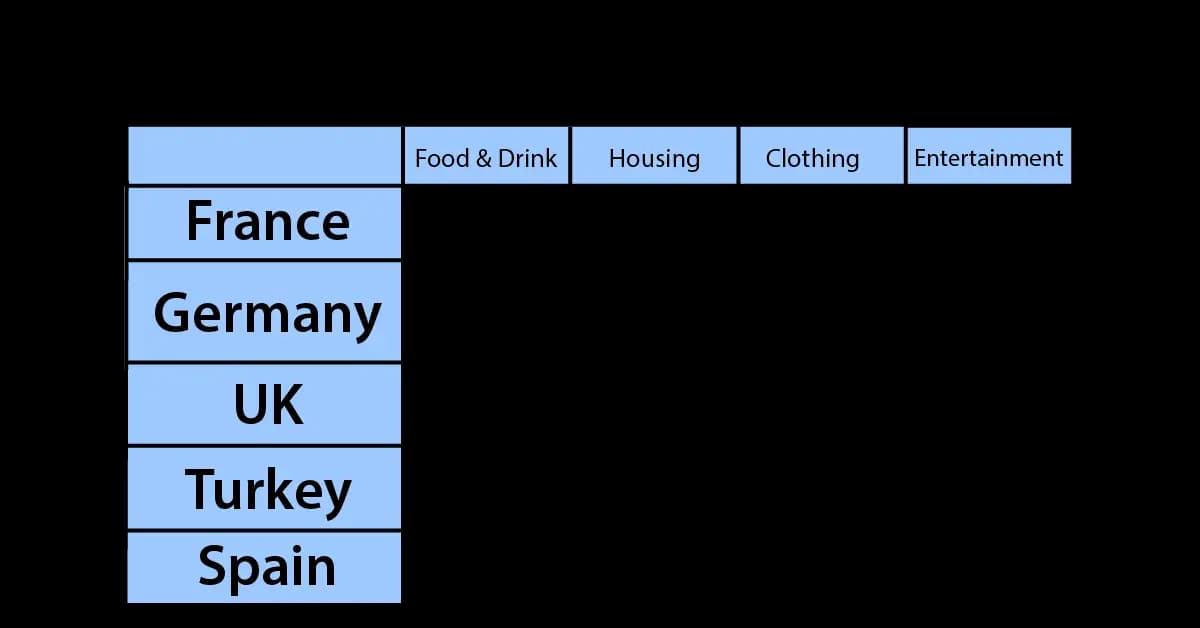
The table illustrates the proportion of monthly household income five European countries spend on food and drink, housing, clothing, and entertainment.
Summarise the information by selecting and reporting the main features, and make comparisons where relevant.
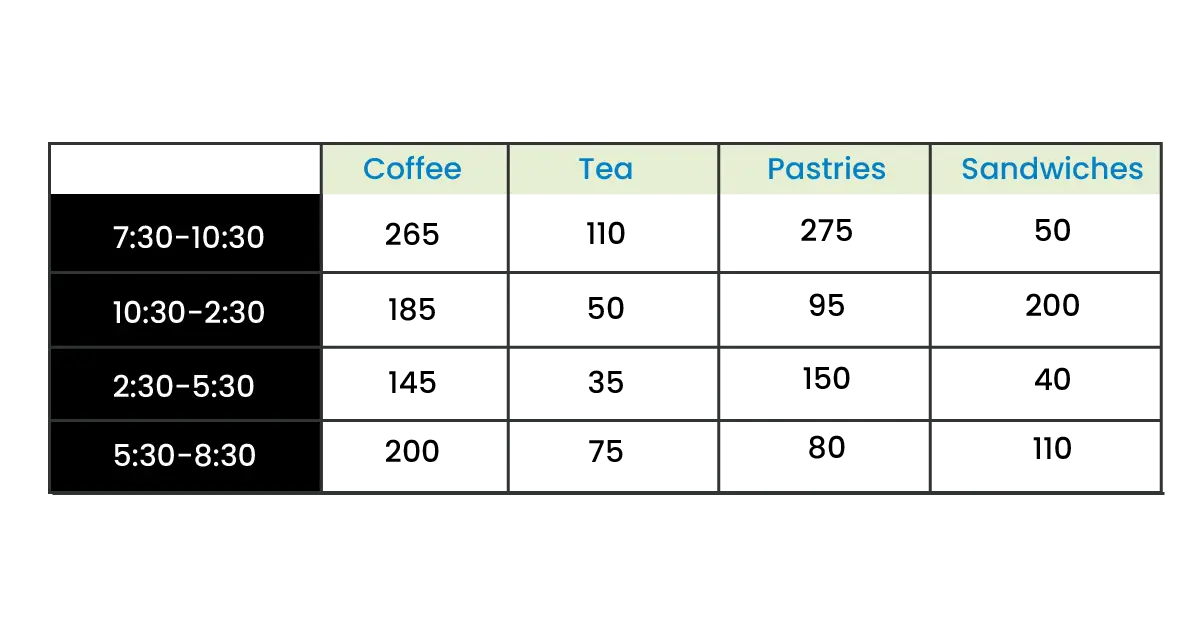
The table shows sales made by a coffee shop in an office building on a typical weekday.
Summarise the information by selecting and reporting the main features, and make comparisons where relevant.
Find out what your answer would score
Reading about tables only takes you so far. Paste an answer in and get a band for Task Achievement, Coherence and Cohesion, Lexical Resource and Grammatical Range, with the corrections that would raise it.