IELTS Writing Task 1: Bar Charts
Bar charts test comparison. Before you write anything, decide which kind you have been given: bars compared across categories, bars grouped by year, or both. Each needs a different answer, and answering the wrong one is the most expensive mistake on this question.
What the question looks like
Bars compared across categories, sometimes grouped into years or into two populations. If there is a time axis you must describe change as well as difference. If there is not, the answer is pure comparison.
The instruction line is the same on every Academic Task 1 question: Summarise the information by selecting and reporting the main features, and make comparisons where relevant. You have about 20 minutes and need at least 150 words.
The overview sentence
Name the largest and smallest category and the difference that stands out most. If the chart spans several years, add the overall direction of travel.
Overall, food and drink accounted for the largest share of spending in both countries, while the clearest difference between them was in leisure, where one country spent far more than the other.
How to structure the answer
- 1
Introduction
Paraphrase the prompt, keeping the categories, the place and the date intact.
- 2
Overview
The highest, the lowest, and the most striking difference between the groups. No figures.
- 3
Body 1
The largest categories, with figures, compared directly against each other rather than listed.
- 4
Body 2
The remaining categories, plus anything that changed rank if the chart covers more than one year.
Language for bar charts
Lexical Resource is a quarter of your Task 1 mark. These are the phrases this question type actually calls for.
- Comparatives
- higher thanlower thanconsiderably more thanmarginally less than
- Multiples
- twice as many asthree times higher thanhalf as much asa tenth of
- Superlatives
- the highestthe lowestthe second largestby far the greatest
- Similarity
- roughly equal tocomparable withat a similar level toalmost identical
- When bars are grouped by year
- rose from X to Yremained stableovertooknarrowed the gap
Mistakes that cost marks
- Listing every bar in turn without comparing anything.
- The rubric asks for comparisons. Nearly every body sentence should hold two things against each other.
- Missing the time dimension when bars are grouped by year.
- If there are years on the chart, describe change as well as difference.
- Repeating the prompt word for word as your introduction.
- Paraphrase it. A copied introduction is not counted toward your word total.
- Writing an overview that just restates the introduction.
- The overview reports what the data shows, not what the chart is about.
- Comparing bars that use different units or scales.
- Check the axis labels before claiming one bar is bigger than another.
Bar Charts: sample questions
Real bar chart questions in the exam format. Give yourself 20 minutes and 150 words for each.
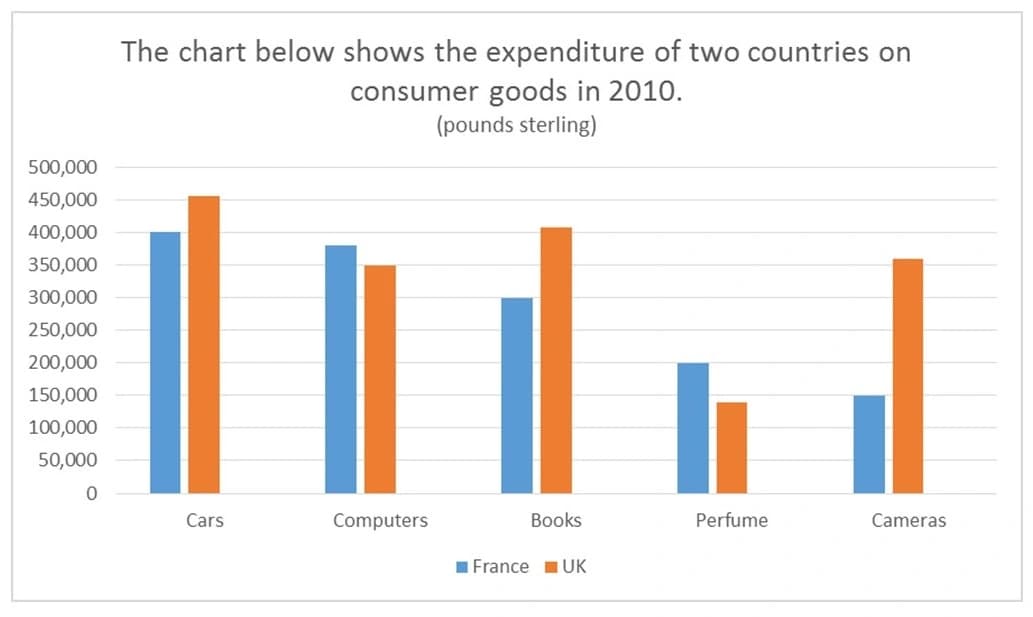
The bar chart shows the expenditure of two countries in consumer goods in 2010.
Summarise the information by selecting and reporting the main features, and make comparisons where relevant.
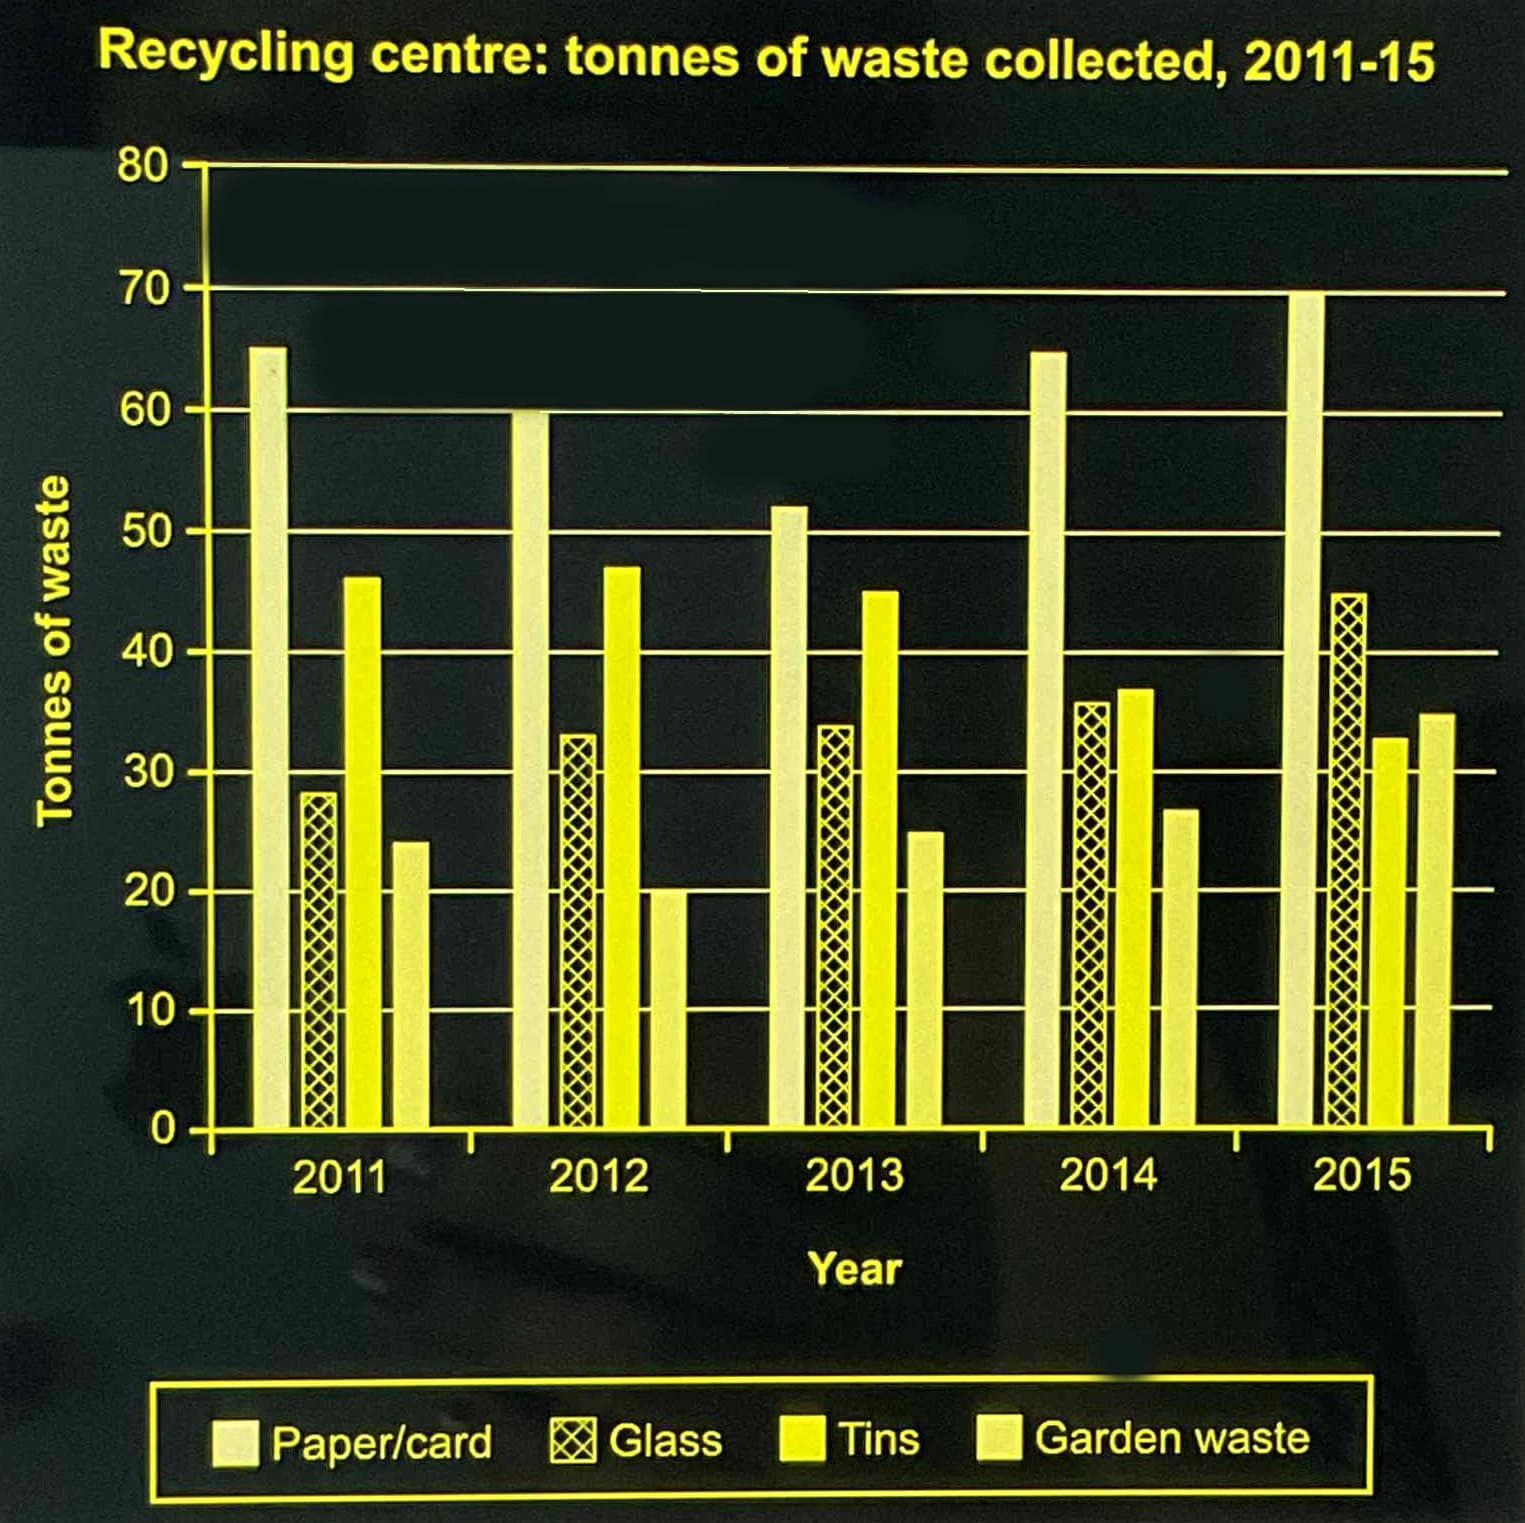
The chart below shows the amount and type of waste collected at a recycling centre in one UK town between 2011 and 2015.
Summarise the information by selecting and reporting the main features, and make comparisons where relevant.
Find out what your answer would score
Reading about bar charts only takes you so far. Paste an answer in and get a band for Task Achievement, Coherence and Cohesion, Lexical Resource and Grammatical Range, with the corrections that would raise it.